


Can you write a poem about a graph? Can you grab a column of numbers, distill them to their purest form, and use them to paint a picture? I’ve spent my career trying to make numbers seem interesting. My last three companies, all nonprofits, in reverse order: a library, a domestic violence shelter, a community center. Human services: education, life-affirmation, fitness, information, equality, legal services, early childhood instruction, books, movies, music. At each company, a large, dedicated staff deliver these services, execute the mission of the organization. And just one guy to keep the books. In all these jobs, I’m the odd man out. The accountant.
< You can snicker here. Everyone else does. >
It’s OK. My job suits me, I’m good at it. I’m not bored by numbers, although others may wince or become glassy-eyed when my part of the meeting arrives. “Let’s look at account 2321 on the balance sheet…”
I think numbers are cool.
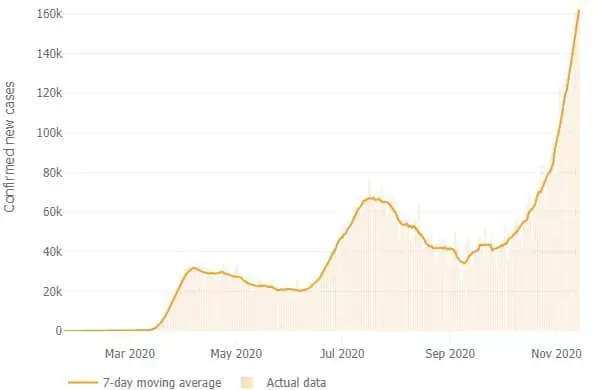
The last ten months have been a numbers geek’s dream. A daily parade of figures—cases, hospitalizations, deaths—for me to obsess over. To calculate death rates, to run averages, to extrapolate exponential curves to predict the future figures for the coming days. Before you protest: yes, I’m fully aware that these numbers represent real people whose lives are being ruined and lost. Covid 19 is not only deadly, but it’s leaving a trail of disabled survivors. This is the one stat that’s rarely reported in the daily news. I think about those people every day.
In 2014, a psychologist diagnosed me as having Obsessive Compulsive Disorder. Not a huge intellectual stretch for him. I’m a textbook case of obsessive thinking. But for me, a huge surprise. In retrospect, this is ridiculous. As a child, I spent twenty minutes every night checking the locks and lights and even digging behind the clothes in my closet to check for intruders—mortal and supernatural.
In 2016, I tried out a medication for Tourette Syndrome, a disorder that causes involuntary movements and vocalizations. Fun fact: Sixty percent of people with Tourette Syndrome also have OCD. The medication works, sort of. I still have involuntary movements and vocalizations, but probably not as bad as I would… maybe… I guess. But it doesn’t matter, the medicine seriously reduces the OCD. So I take it. Gone are the obsessive thoughts that kept me awake half of every night. I haven’t gotten out of bed at three in the morning to write a to-do list in four years.
Cured? No. A quick scan of my blog since January will show that the pandemic has been my area of obsession since long before President Trump acknowledged we had domestic cases. I’m still obsessive, just less than I was. A lot less.
A conversation from breakfast. Me: “I think the United States is going to shut down again.”
Susan: “What makes you say that?”
Me: “We’ll be hitting 180,000 daily cases by the end of the week.”
Susan: “Is that a lot? Where are we now?”
This is when I learned that Susan doesn’t click on the Covid 19 graph ten times a day. But I do. Even though I typically know within five thousand, how many cases we’ll have each day. I still check morning, noon and night (and late morning, and early afternoon, when I get home from work, after I run, after dinner, at bedtime…). I can’t look away.
If I were to psychoanalyze myself, I’d say it’s all about control. If I check the numbers and they’re where I expect them to be, I don’t freak out. I use the Washington Post’s Covid graph. Yes, I know it’s vogue to use the John’s Hopkins map, I used it way back in January, but I think the Post’s graph is easier to read. I can drill down to state and county-level information easier. Plus, I paid for an annual subscription to the Post. I feel compelled to get my money’s worth. Every now and then, the Post throws out a kooky chart. Like the day the number of deaths jumped by 400%. I think they try to sync their data with the Hopkins map every now and then.
When I see a 400% increase in a day, it disrupts my planning. The pandemic has an orderly and predictable curve. Outlier days ruin the chart. I know the case growth over the past five weeks, which helps me plot the likely growth over the next three.
Based on conversations I have with others, I know this level of obsession is unnatural. Many of you reading this blog post are shaking your heads right now, wondering if I should be in therapy. I don’t know. Yes?
This is simply the way my mind works. Much like my involuntary movements and sounds, I follow the pandemic through involuntary thoughts. If I could get a job predicting Covid infections for the duration of the pandemic, I’d be killing it.
—
Previously Published on jeffcann.com
—
Image jhu.edu

